

Is AI for customer success actually delivering results, and which tools are proven?
Retention got worse in 2025. Benchmarkit's 2026 B2B SaaS report puts median gross revenue retention at 84% for the year, down from 88% the year before, with the 75th percentile down from 95% to 91%, and the report names AI itself as one of the headwinds: AI alternatives pressuring renewals, and customers cutting seats as their own teams get leaner. Net retention at private SaaS companies sat around 101%, flat on the year, in KeyBanc and Sapphire's 2025 survey. Bain's practitioner survey (235 respondents, August 2025) adds the finding that stings most for a customer success leader: net revenue retention declined even as companies hired more customer success roles.
That is the backdrop against which a board asks what AI has done for retention. The published evidence gives a two-part answer. AI is proven at prediction: models that identify which customers will churn are consistently accurate. AI is far less proven at outcomes: there is no independently audited case of AI causally lifting net or gross revenue retention at any company, and almost every quantified result in circulation is a vendor's own report of its own customers. So before asking which tools are proven, a leader has to ask which tools produce a result that can be checked at all. The rest of this piece takes the value drivers one at a time, explains why most results cannot be checked, and then sets out what a checkable result looks like.
What the published evidence says about AI in customer success
The evidence is uneven across the four value drivers, so they are best taken one at a time, starting with the one where it is strongest.
On retention, the prediction half of the job is settled. Ensemble churn models reach an AUC-ROC of around 0.93 on public datasets in peer-reviewed work (Scientific Reports, 2025; Frontiers in Artificial Intelligence, 2026), which means they rank customers by churn risk about as well as the data allows. G2's February 2026 expert survey draws the practical conclusion: a churn model only needs to be accurate enough to justify the cost of intervening. Model accuracy stopped being the limit some time ago. What limits retention now is whether anyone acts on every account the model flags, consistently, for long enough for the effect to show, and that is where the evidence thins out.
Onboarding is where the mechanism claims agree with each other and the numbers do not hold up. Vendors describe the same three things AI does: it detects the customer whose setup has stalled, coordinates the steps and the people, and carries context from the sales handover into the first weeks. That much is consistent. What is missing is analyst-grade before-and-after data on time to value; the percentages that circulate come from the companies selling the software.
Expansion has the thinnest evidence and the highest stakes. The stakes are high because Benchmarkit finds expansion now supplies 40% of net-new annual recurring revenue at the median company, so post-sales is carrying the growth load. The evidence is thin because the one analyst-grade figure, McKinsey's 2025 finding that companies running AI-powered next-best-experience programs see 5 to 8% revenue uplift and 20 to 30% lower cost to serve, spans sales and post-sales together, and no benchmark isolates AI's contribution to expansion pipeline. Organizations are not waiting for the benchmark: ICONIQ's 2025 State of Software shows AI-native companies putting 31% of go-to-market headcount into post-sales, against 23% at traditional SaaS companies.
Underneath all four sits Bain's 65% figure. If customer success managers spend about two thirds of their time on lower-value work that could be automated, the capacity AI could return to a team is large. The same survey found that retention fell while headcount rose, which means adding capacity on its own has not improved retention. Capacity only helps when it is pointed at the accounts that were not getting attention, and whether that happened is exactly what most AI results never show.
Why most AI customer success results cannot be checked
TSIA's State of Customer Success 2026 summarizes the pilot years in one line: pilots showed promise, and value was never fully quantified. The reason is structural. A team turns on a tool, watches a number improve over a quarter, and reports the improvement, and that report is usually missing three things.
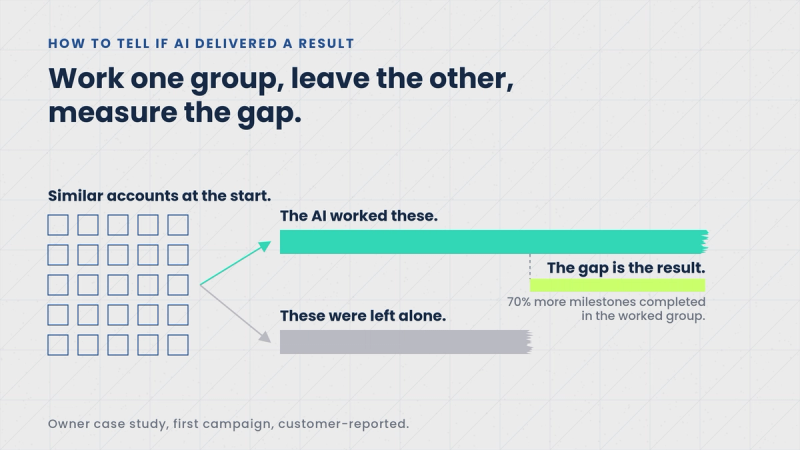
It is missing a baseline measured before the tool arrived, on the same definition. It is missing a comparison group, meaning customers who did not get the intervention but were similar enough to the ones who did that the difference between the two groups can be read as the effect. And it is missing a metric the business runs on: time saved per manager is an input, while churn, activation and revenue are outcomes, and a result stated in inputs leaves the outcome question open.
Without those three, a 20% improvement in renewal rate could be the tool, the pricing change that shipped the same quarter, the two enterprise logos that were always going to renew, or the market. Nobody can tell, including the team that reported it. That is why the negative result stands: the measurement that would show AI succeeding at retention has rarely been designed in, so the evidence that would settle the question has rarely been produced.
Which tools are proven: how to read a vendor's number
A customer success leader evaluating tools this year is reading case studies, most of them written by the vendor. Five questions separate a result that can be checked from one that cannot, and they follow directly from the three missing things above.
- Is there a comparison group? A result that compares customers who received the intervention against similar customers who did not is measuring the tool. A result that compares this quarter to last quarter is measuring the quarter.
- Is the customer named? A named customer with a named executive can be asked how it went. An anonymized "leading SaaS company" leaves the reader with nothing to check.
- What was the population? A first campaign to a chosen segment and a rollout across an entire customer base are different claims, and both are legitimate when they are labelled.
- Is the metric an input or an outcome? Hours saved and emails sent are inputs. Customers retained and revenue expanded are outcomes.
- Who measured it, and when? A number the tool produced as part of its own operation, at the time, is easier to trust than a number reconstructed from a spreadsheet after the fact.
A tool that measures its own effect against a comparison group as it runs will produce results that pass this test by default. A tool that leaves measurement to the customer will produce results that pass it only when the customer had the discipline to build the comparison in before starting, and the TSIA finding suggests that is rare. That is the standard Trig's own published results should be read against.
What Trig's customers measured
Trig's published results are customer-reported case studies, with the customer named and the measurement described. Here is what they show, with the population and the method stated so they can be read against the five questions.
Owner, a platform used by independent restaurants, wanted new customers to finish onboarding milestones such as menu photography and website copy without an eight-person team spending four hours a day chasing them. The first campaign went to a chosen group of customers with an incentive to complete the remaining steps. That group completed milestones at a 70% higher rate than customers who did not receive the incentive, which makes it a comparison-group result on a first campaign. Owner then extended Trig across its customer base. Across that rollout, pre-live churn fell 52%, the time to collect onboarding assets fell 80%, three times as many customers had every asset in place at launch, time to value went from 32 days to 2, and Owner puts the business value at over $1.3 million, a twelve-times return on what it paid.
Nory, an operating system for hospitality businesses, ran a first campaign against the steps where new restaurants stalled during onboarding, with a reward for completing each one. Initial product activation in the campaign group rose from 30% to 83%. Two thirds of those customers completed onboarding in under ten days, adoption across the campaign rose 266%, and every targeted contact opened the message. That is a first-campaign, chosen-segment result. The activation figure is a before-and-after on the same definition, with no held-back comparison group, which is why the population is stated.
CloudTrucks, a marketplace matching drivers with loads, is the expansion example. Trig identified drivers who had shown spare capacity over the previous weeks and offered them a reward for completing four loads in the coming week. 42% hit the target, 21% went past it, and 52% recorded their highest load volume of the previous four weeks, which is each driver measured against their own recent baseline. The result card on the case study reads 21% expansion for the target segment.
Read against the five questions: every customer is named, every population is stated, one result has a comparison group, one is a same-definition before-and-after, one is a per-customer baseline, and all three report outcomes. The reason they can be described that precisely is the subject of the last section.
Why the measurement has to be built in
Those results can be described in those terms because the measurement was part of how the system ran, from the first campaign. Trig tracks how many customers entered an objective, a stage, or a Job (a Job is a piece of account work Trig carries out, such as an onboarding follow-up sequence, that the team approves before it runs), how many completed it, how long it took, and how engagement changed afterward. It estimates uplift by comparing the customers a Job targeted against similar customers it did not target, and those results feed back into the system as new signals about what works on which accounts. The comparison group exists from the start because the system needs it to learn, and that is what makes the result checkable later.
What this means for the team
The question to put to any AI in post-sales, including this one, has three parts: what was the impact, compared against which group of customers, and how was it measured. A pilot that cannot answer that will end the way TSIA describes, with promise and no quantified value. A pilot designed to answer it from the first campaign gives the customer success leader something rarer than a vendor's percentage: a retention number of their own, with the comparison group attached.